The 1987 Stock Market Comparison to Today. Significant Lows Are in Place.
/Good Friday morning all. I’ll repeat…December ’18 will be viewed as an aberration. A perfect storm of stock market negativity…90% of it structural/political…that marked significant long term lows. And we have some hard evidence to back it up.
First, I’ve been referring to this correction/bear market as the 2.5 month version of the 1 day 1987 crash. I lived and worked through the ’87 Black Monday and those that sold their positions on Monday would go on to forever view that as the single biggest mistake of their investment careers.
I watched as seasoned, 20–30–40 year stockbroker veterans, entered “market orders” at mid-day that Monday. Just doing whatever possible to get their clients OUT.
What a mistake. What they had no way of knowing at the time was that the floor of the NYSE was so overwhelmed by sell orders that anything sold at market on Monday would not receive a final fill price (confirmation) until 3 days later…Thursday. I’ve never seen more depressed and absolutely bewildered men, as they learned that their market orders had been filled at the “exact lows” from Mondays 21% crash.
By Thursday, when they got the awful news, the same positions that they sold…blue chip stocks all…had already recovered more than 1/2 of their losses. To make matters worse, by the end of 1987, the Dow Jones would actually close 2% higher on the year. Life-long careers were ended that week. Our firm was a morgue, for many months to come. Selling into a vacuum…like ’87 and like 12/18…is/was a mistake.
Take a look at the following, from Troy Bombardier. Like ’87, the S&P 500 just fell more than 1.5% for 4 consecutive days…it then rose more than 5.8% over the next 2 days. From 1927 on, this has occurred just 2 times. 1987 and 12/18. And like ’87, multi-year lows are likely in place, today.

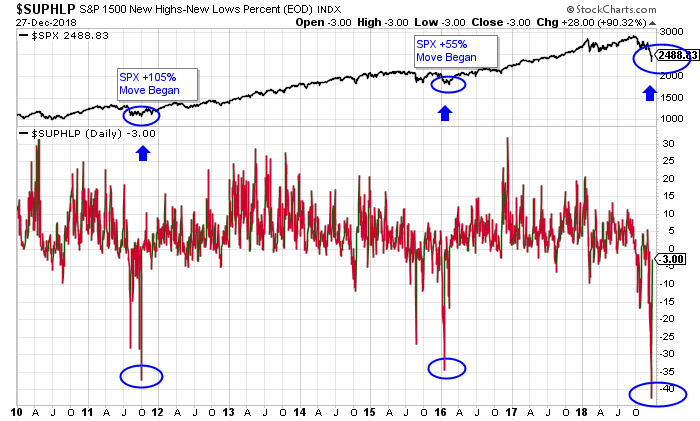
This is the same chart that we’ve focused on since the Christmas eve capitulation, when the S&P 1500 reached its most oversold levels in the history of the S&P 1500 (1500 largest co’s in the US). As we wrote at the time, this is exactly what capitulation looks like…42% of all S&P 1500 stocks hit a 52 week low, this Christmas eve. But its what happened next that we want to key on; following the 2011 lows (37% at new 52 week lows), the S&P 500 began a move that would take it 105% higher. Then, following the 2016 lows (34% at new 52 week lows), the S&P 500 began a move that would take it 55% higher.
Importantly, yesterdays trading gave us exactly what we wanted to see. A big, near 900 point move higher in the DJ (from -630 to +260), and it took place with new 52 week lows putting up MUCH better readings of just -3% on the day. This was and is my most important market internal. It looks very much to have marked the lows.
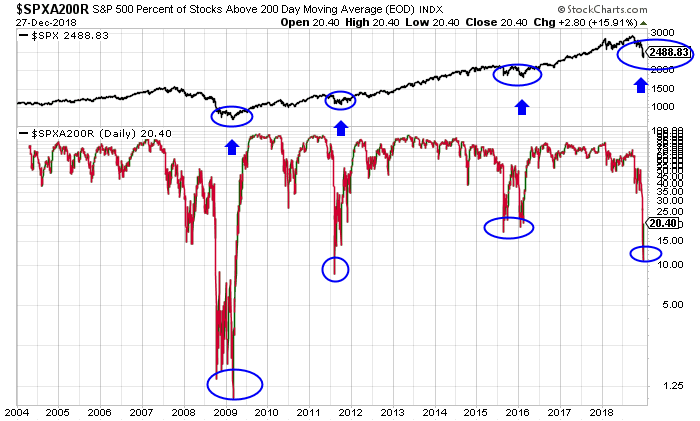
Now, take a look at the S&P 500 percentage of stocks below their 200 dma. On Christmas eve, we hit the 3rd lowest reading on record, with just 12% of S&P 500 trading above its 200 dma. History tells us that the previous 3 low readings also marked important capitulation in the stock market.
By no means are we out of the woods. Should we retest and break the Christmas eve lows, then we have real trouble on our hands. I see the probability of this now as “extremely low”.
The smart play is to continue to use dips. Buying the dip is the only move that makes smart money sense, based on my 33 years of doing this and the historical data that tells us this goose was way too overcooked.
Like 1987, once the lows were in place, the gains that followed were superb. That’s our stock market, today.
Podcast
Lastly, we recorded an important podcast yesterday, where we got into the following topics
1) December will be remembered as an aberration. A mistake, fed by hedge fund forced liquidations, computer driven sell programs, a hostile Federal Reserve and an air pocket of selling. The Dow now has a 24,300 magnet tied to it (minimum target). 50% retrace. Buy the dips.
2) Dramatic reversal higher yesterdat…from a technical point of view it confirmed Wednesday’s reversal and 1080 point move higher (big). Again, buy the dips.
3) The internals did just what we were looking for yesterday. New 52 week lows, in particular.
4) Best looking sectors for the deep value investor; housing, financials and emerging markets/China. Each is trading at “recessionary levels”.
5) and finally, should we ever see the Fear & Greed Index hit 2 again, sell all of our worldly possessions and buy index call options.
8/12 VRA System Screens remain bullish.
Until next time, thanks again for reading….have a good weekend.
Kip
Experience the Vertical Research Advisory free for 2 weeks!! For a limited time we are offering a 2 week free trial to the Vertical Research Advisory, visit vrainsider.com for more details.
Since 2014 the VRA Portfolio has net profits of more than 2300% and we have beaten the S&P 500 in 14/15 years.
For our latest free updates tune in to our daily VRA Investing Podcast atVRAInsider.comor subscribe to our free blog at kipherriage.com
