VRA Investment Letter: VRA Investing System Update. Strong Evidence of Rotational Bull Market Action. Gold & Silvers Coordinated Smash
/Good Thursday morning. We’d like to welcome our new VRA Readers that have joined us recently, many of which have come to us through our TV work with Wayne Allyn Root, Grant Stinchfield and Charles Payne, three American patriots that we are proud to call friends.
Today, we’ll do a quick recap of where things stand with the VRA Investing System, our recent VRA Portfolio moves and the best places for a new VRA Reader to be invested (to see the full update go to VRAletter.com).
The VRA Investing System is made up of 12 screens, 70% fundamental and 30% technical. Today, 9/12 VRA screens are bullish, which means we MUST be invested in this bull market. For 3 years we’ve been the most bullish market strategists in the country. From calling the bear market bottom (on 10/13/22), over the last 3 years we’ve put up an average return of 37.7% vs the S&P 500 which has averaged a return of 20.7%, with an average return of just 12.7% for our primary index bogey, the Russell 2000 (small caps).
Our medium-long term view has remained unchanged. This is a generational bull market, driven by our “Big 3”; 1) the Trump Economic Miracle, 2) the Innovation Revolution and 3) an absolute ocean of liquidity. It’s this powerful combination that will continue to drive this bull market into the 2030’s…the most powerful bull market in decades.
Our investing strategy involves market timing (VRA System), finding the best sectors to invest in, and finally, building positions in our top growth stocks and VRA 10-baggers, companies that have the very real potential to produce gains of 1000%. We never recommend more than 15 positions at a time. It’s this exact approach that has helped us to outperform the markets in 19/22 years, from our founding in 2003.
Roughly two weeks ago we raised some cash in the VRA Portfolio by taking profits in our ETF Strategy (Join at VRAletter.com to see the trades). The reasons? We were hitting extreme overbought levels in several of our leading indexes along with the fact that short term risks directly ahead could result in a market shakeout. Each year, even in the strongest of bull markets (like this one), “overbought market resets” take place. We see the current downdraft as normal and yes, even healthy.
While our “heavy market” vibe continues, we also continue to see signs of rotational bull market action, with one sector bearing the brunt of the damage, as software stocks (IGV) are down more than 30% over the last 3 months. In a rotational theme like this, money doesn’t leave the market, it simply rotates into other areas and we’re continuing to see in strength in industrials, commodities, banks and energy. In fact just yesterday the equal weight S&P 500 closed at an ATH, as did the transports, energy and banks.
In addition, market breadth has been strong. While tech is weighing down the S&P 500, breadth keeps expanding. Again, this is sector rotation.
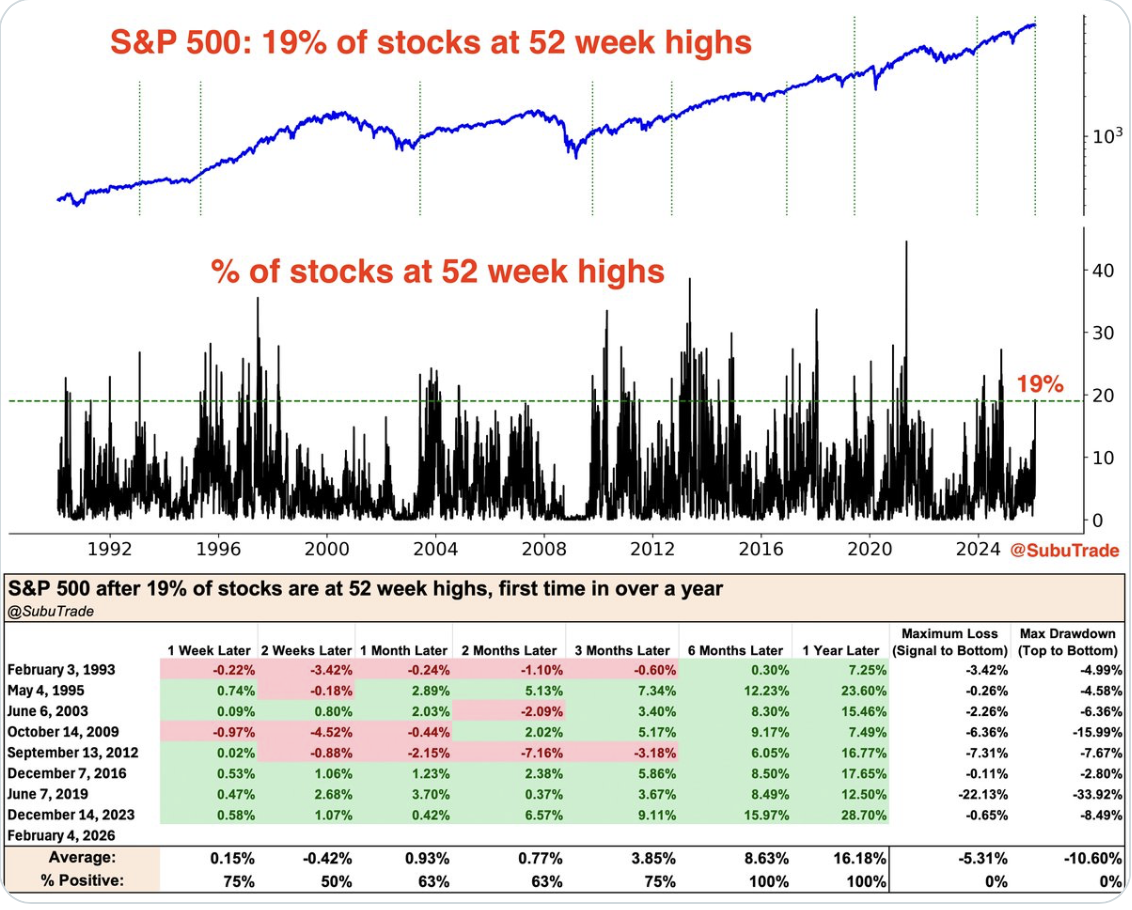
With thanks to SubuTrade we have some excellent data: for the first time in over a year, 19% of the S&P 500 is at 52-week highs.
In past instances like this, the S&P 500 was higher 6–12 months later every single time.
In what was a head turner, Alphabet (GOOGL) reported earnings after the close where they announced that they are increasing CAPEX in 2026 from $119 billion to an astonishing $175-185 billion. The levels that CAPEX continues to grow points to the AI boom as being “early”.
Planned capital expenditures for 2026:
- Alphabet (Google): $175 billion–$185 billion (+102% YoY)
- Amazon: $146 billion (+18% YoY)
- Meta: $115 billion–$135 billion (+93% YoY)
- Microsoft: $105 billion (estimate, +64% YoY)
- Tesla: $20+ billion (+135% YoY)
- Apple: $14 billion (+10% YoY)
Total: More than $605 billion combined, most of it AI-related.
VRA Bottom Line: Unless the largest and most powerful tech companies on the planet are making company-derailing mistakes, the AI boom is still early innings. This morning, futures are lower across the board (by roughly .50%). We’ve had a recent pattern of higher opens met with mid-day selling pressure. Maybe what’s needed now is a lower open and a higher close. We continue to key on the semis/tech, market internals and action in the smart money hour. Once the semis begin to lead higher (again) we will know that the coast is clear and we can begin putting some money back to work with our ETF Investing Strategy.
Gold & Silvers Coordinated Smash
In last week's VRA Investment Letter we began alerting that gold/silver and miners were hitting extreme overbought on steroids (EOBOS) with the USD hitting EOSOS and that the risks of a counter trend move in both were high. AKA Bad things tend to happen at extreme OB….
From Thursday's Letter – “Trading note: with gold/silver and miners hitting EOBOS while at the same time the USD is hitting EOSOS, at some point we should see a countertrend move in the other direction. Again, this is basic VRA System methodology/probabilities.”
Following Thursdays surge through $5600/oz gold and silver through $120/oz, once Kevin Warsh was named as the new Fed Chair Friday morning, followed by the CME increasing margin rates for futures contracts, the extreme overbought selloff was on (with a corresponding jump in the dollar).
Most importantly, the global demand story for gold and silver has not changed one iota. The primary trend of higher prices for this group will remain in place, with several years to run for this bull market. Check this out; the dislocations we’re witnessing in the silver markets are absolutely insane.
Silver: Same ounce – Same metal.
New York COMEX: $80/oz
Shanghai SGE: $111/oz
India MCX: $93/oz
Japan retail: $120 /oz
Kuwait retail: $106/oz
There’s a 40% spread between New York and Shanghai silver prices, the largest sustained divergence in precious metals history. Know this; physical silver prices will win in the end and silver paper dislocations will lose.
VRA Bottom Line: we’ve just witnessed a coordinated smash in the prices of gold and silver, which allowed the shorts (led JP Morgan) to cover, ending what had become a true parabolic move higher in gold and silver. As we’ve seen over the last 3 years, manipulation fails in the end. We fully expect this extreme OB shakeout to be short-lived. Our PT for gold remains $15,000/oz and silver $300/oz.
Until next time, thanks again for reading.
Kip
Join us for two free weeks at VRAletter.com
Please join us each day after the market closes for our Daily VRA Investing Podcast! @ https://vraletter.com/podcasts/
Also, Find us on Twitter and Rumble
